I. Pre-Debugging Preparations
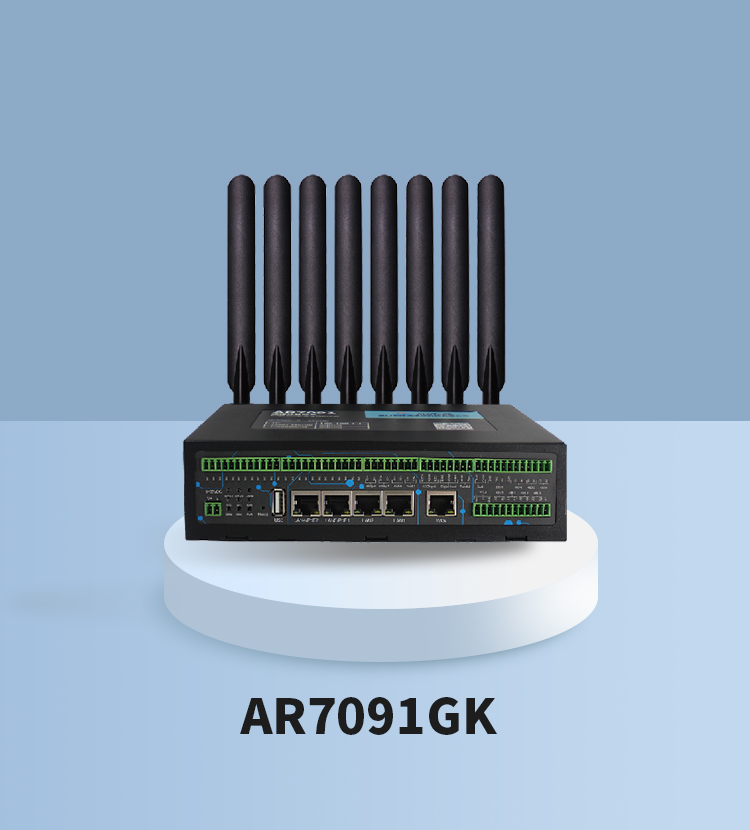
The starting point for all debugging work lies in having a comprehensive and in-depth understanding of the DTU device. This includes the device’s model, specifications, performance indicators, and the communication protocols it supports. Carefully reading the device’s manual and understanding its working principles are the cornerstones of ensuring that subsequent debugging proceeds smoothly.
“To do a job well, one must first sharpen one’s tools.” The tools and accessories required for debugging DTU should not be overlooked. In addition to a basic computer, serial port debugging tools, network cables, and USB-to-serial cables are also essential. Ensuring the compatibility and quality of these tools and accessories can effectively improve debugging efficiency.
II. Device Connection

There are typically two ways to connect a DTU to a computer: via a serial port cable or a network cable. Serial port connections are suitable for scenarios where data transmission speed is not a high priority, while network cable connections have become the preferred choice for many users due to their high speed and stability. The choice of method should be based on actual on-site conditions and requirements.
Whether it’s a serial port cable or a network cable, the stability of the connection is key to successful debugging. Checking that the interfaces are clean and dust-free, ensuring that the cables are not damaged, and that they are firmly connected are all fundamental to ensuring smooth communication.
III. Device Configuration
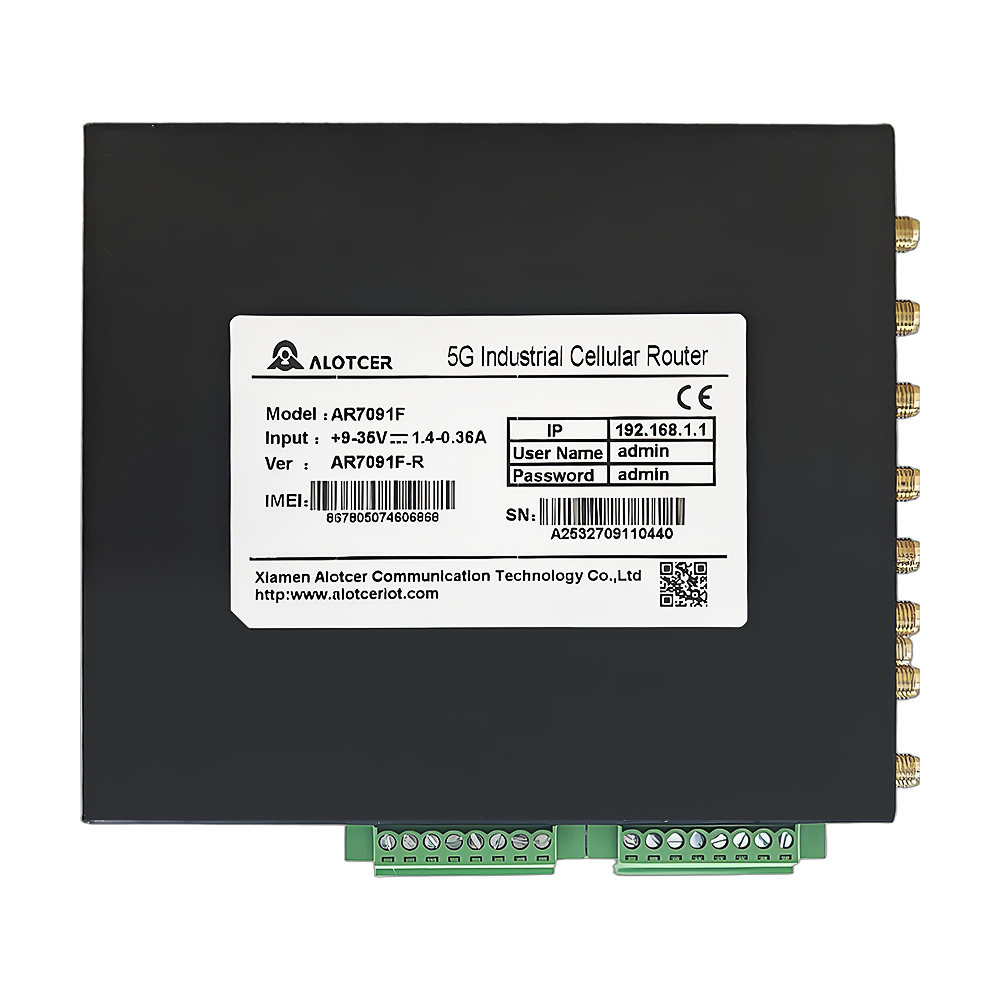
By entering the DTU’s IP address through a serial port debugging tool or typing the device management address into a browser, you can access the DTU’s configuration page. This step is akin to opening a door to the inner world of the device, allowing the debugger to deeply customize the device.
In the configuration page, the debugger needs to carefully set key parameters such as communication protocols, baud rates, data acquisition methods, and data transmission strategies according to actual needs. The choice of these parameters not only affects whether the device can work properly but also directly influences the efficiency and quality of data transmission. Therefore, when configuring, one must be meticulous, ensuring that each parameter is accurate and correct, meeting on-site needs while considering the stability and efficiency of the system.
IV. Testing and Optimization
After the parameter configuration is complete, it’s time to test the results. By simulating actual working environments and observing real-time data transmission, checking device status indicator lights, one can verify whether the DTU can accurately collect and transmit data to the monitoring system. This process requires patience and attention to detail, as any minor anomaly could be a sign of potential problems.
If data transmission abnormalities or device status not as expected are found during testing, one should immediately initiate a troubleshooting mechanism. First, check whether the physical connection is stable, then check each configuration parameter for correctness. If the problem still cannot be resolved, one should promptly contact the equipment supplier for technical support or consider equipment replacement.
V. Successful Debugging
After a series of tests and optimizations, when the DTU device can stably and accurately collect and transmit data, it means that the debugging work has come to a successful end. At this point, connecting the DTU to the upper monitoring system ensures real-time data transmission and monitoring, providing strong support for intelligent management of industrial sites.
Although the debugging work is over, the stable operation of the DTU still requires continuous monitoring and maintenance. Regularly checking device status, updating firmware, and dealing with potential network fluctuations are all indispensable parts of ensuring the system runs stably in the long term.